I had an interesting experience last week at a customers. I happened to be onsite to discuss why 4 Catalyst 4500 chassis had failed in 6 months. Each of them had similar symptoms, packets would no longer pass through them and a "show module" would either show the modules as not present or failed.
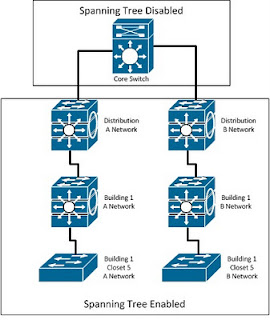
First we need a description of how the network is designed. This network is divided into "Network A" and "Network B". The separate networks represent the "business users" and the "operations users and systems". At the core of the network they have a single Catalyst 6500 with down links to Network A and Network B Catalyst 4500 switches.
The respective Catalyst 4500s have multiple down links to their respective Network A and Network B distribution Catalyst 4500s. These Catalyst 4500s have uplinks to access-layer switches. Each wiring closet has two switches, one for each network. If it is not clear, there are NO redundant links. There should be no loops in the network.
Here is a very simplified few of the network.
Now we get to the origins of the problem I would experience. The situation has been explained to me as this "when we implemented the network spanning tree was very buggy. So we disabled spanning tree on the 6500. I thought spanning tree would be enabled at some point." Oh boy!!!
So back to my incredibly good timing onsite. We were in a car heading to a building to look at the wiring closet were multiple Catalyst 4500s had failed the past few months. The customer driving the car got a call, users connected to Network B, or the operations and systems network, were unable to connect to their systems. Essentially, the operators were not able to see how the plant was operating. It also looked like the operations management systems were not able to see how the systems were operating. uh oh!!!
We headed back to the main building and I began troubleshooting the network. The CIO and multiple managers were standing behind me anxiously waiting for a diagnosis. I found the top Catalyst 4500s for the Network B side of the house, had its 1 GB uplink running at 95% utilization.
From previous work here, I knew spanning tree was disabled on the 6500, so I was worried about a loop (I have worked with this customer for 2 years. Each time I met with them, I recommend they should enable spanning tree, but there was always strict change controls which discouraged the customer's engineers from enabling spanning tree and a fear of something bad happening).
Suspecting a loop, my suggested to the CIO that I enable spanning tree. Asked about the impact, I said there could be 2 minutes when un-affected users and servers could have connectivity disrupted while spanning tree converged (yes 2 minutes is longer than required I wanted them to have appropriate expectations). He agreed, and on the core Catalyst 6500, I enabled spanning tree for all VLANs and set the switch as the spanning tree root of the network.
I thought I had the Loop in the network blocked. I now expected the network to spontaneously recover. Operations still couldn't connect to their systems. What was wrong?
I looked at the top-most Catalyst 4500 "B" switch. On this switch, I checked the CPU utilization. The CPU was pegged at 99%. A CPU running at 99% is an indication of a switch process switching a ton of packets. There are several types of packets which are processed switched, but I suspected Broadcast packets.
I need to find were the broadcast packets came from. I cleared the interface counters, then ran this command several times over a minute:
show interface | include Gigabit|broadcast.
I quickly saw a single interface with a lot of broadcast packets. I connected to the downstream switch connected to the interface and repeated the command looking for an offending interface. I found it and connected to the access-layer switch. Remember, the network is divided between Network A and Network B.
I was connected to a switch named 3560-B-Bldg1.
show cdp neighbor revealed the switch was also connected to a switch named 3560-A-Bldg1. I had suspected a loop, but hadn't looked for one or found one. I thought enabling spanning tree on the core switch would take care of it. I had finally found the loop!!
Things should have calmed down, but the had not, why? I looked at the interfaces on the 3560s that connected them together. The interface connected to each other on 3560-A-Bldg1 and 3560-B-Bldg1 had the same configuration:
interface GigabitEthernet 0/#
switchport access vlan 500
spanning-tree portfast
Both interfaces were configured as access ports to VLAN 500 and had portfast enabled. What is on VLAN 500? This is the VLAN used by the operations systems, users, and management systems. I had enabled spanning tree at the core, but this did not stop the loop. When spanning-tree port fast is enabled on an access interface, that interface does not participate in spanning tree.
As Astro says, "rut ro!"
I shut down the Gigabit interface on 3560-B-Bldg1. Finally, this should have corrected the problem...
When you have a loop in the network, what is the most damaging type of traffic...Broadcast..So I went back to looking for broadcast traffic. On 3560-B-Bldg1 I resumed running the
show interface | include Gigabit|broadcast command. One interface appeared to receive an abnormally large amount of broadcast traffic. In fact the interface received about 55 million broadcast packets in 60 seconds. So I shut down that port.
The network finally recovered!
Observations / Lessons learned
- Never disable spanning tree globally on a switch
- Spanning-tree portfast disables spanning tree on an interface
- consider running on every switch bpduguard


